In this chapter, usage of INTERGLAD Ver. 6 is demonstrated through the introduction of actual examples. (See Chapter 4, "Detailed explanation of INTERGLAD windows", for details concerning navigation.)
 1. Retrieval and analysis of collected data
Start up INTERGLAD Ver. 6. After a splashscreen appear, the main window is displayed.
The content of each item of collected data in the INTERGLAD database is shown on the left side of the screen. At the outset, one might wish to ascertain the number of glass data that can be found using keywords pertaining to the type of information one wishes to retrieve.
Select [Go Query] in the initial window. The query specification window is displayed.
 (1) Retrieval of commercial glass data
Here, a named high-strength fiber glass for FRP is first retrieved from the catalog data, after which the methods used to collect more detailed information on the glass based on the name of the commercial product are introduced.
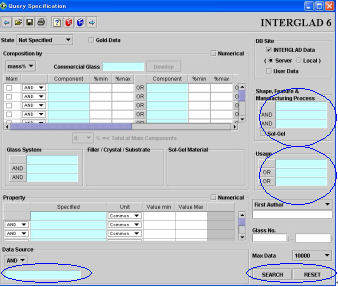
After initializing the query specification window by clicking on the [Reset] button, double-click in the light blue area titled [Data Source] so that the [Data Source] dialog box is activated, then select [Catalog] and click the [OK] button.
Now, double-click in the light blue area titled [Shape, Feature & Manufacturing Process]. The dialog list box is activated. Then click the
 mark to the left of 'Appearance' . Select 'Fiber' among the items shown
under 'Shape' - 'Linear' by clicking on 'Fiber' , then press [OK].
mark to the left of 'Appearance' . Select 'Fiber' among the items shown
under 'Shape' - 'Linear' by clicking on 'Fiber' , then press [OK].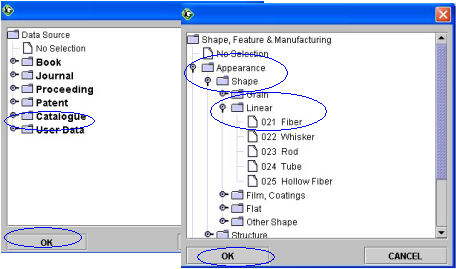
Next, double-click in the [Usage] area so that the dialog list box is activated. Click the
mark to the left of 'Material' . Select 'Plastics, FRP' among the items shown under 'Material' by clicking on 'Plastics, FRP' , and then press [OK].Note: 'Shape, Feature & Manufacturing Process' and/or 'Usage' are not available for all the glasses. Therefore, that information is not always returned even if those characteristics are specified.
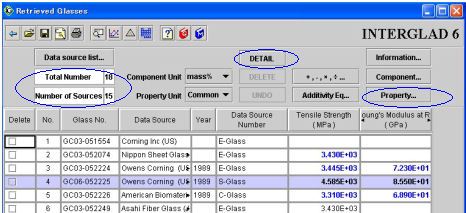
Finally, press the [Search] button. The retrieval process starts and the retrieved glasses window appear after a short time. The number of retrieved glasses is 18. (The number of glasses retrieved and number of sources shown for this particular type of glass are those current at November 2004.)
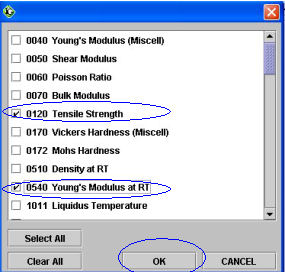
Click the [Property...] button at the upper right of the window. A [Property] list box showing all properties of the 18 retrieved glasses appears. Click the checkboxes next to 'Tensile Strength' and 'Young' s Modulus at RT' and press [OK]. The values of the selected properties are shown in the retrieved glasses table.
Select the glass (GC06-052225) with the largest Young' s modulus value and comparatively high tensile strength by clicking the appropriate line (which turns to blue), then push the [Detail] button. The detail window appears. When the [Data Source] column is examined, the name of the commercial glass turns out to be 'S-Glass' .
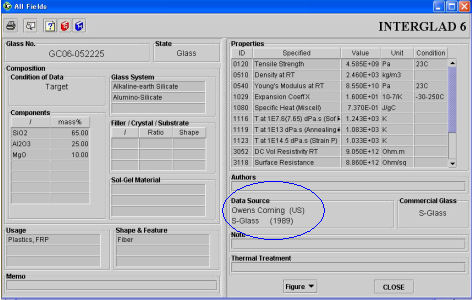
'S-Glass' may now be studied in more detail.
Click the [
 ] icon at the upper left of the retrieved glasses window to go back to
the query specification window. Press the [Reset] button to clear the query
input, and double-click the light blue area [Commercial Glass] in the upper
part of the window. The [Commercial Glass] dialog box is activated. Scrolling
down the dialog box displaying a list of commercial glasses arranged in
alphabetical order, click the mark to the left of [S], click on [S-Glass], and then press [OK].
] icon at the upper left of the retrieved glasses window to go back to
the query specification window. Press the [Reset] button to clear the query
input, and double-click the light blue area [Commercial Glass] in the upper
part of the window. The [Commercial Glass] dialog box is activated. Scrolling
down the dialog box displaying a list of commercial glasses arranged in
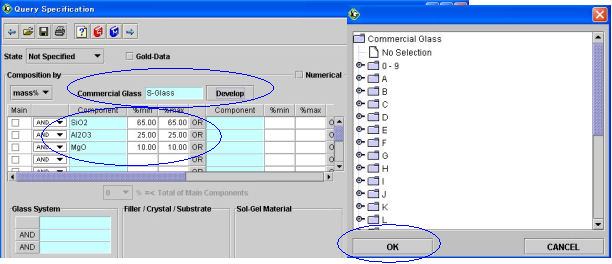
alphabetical order, click the mark to the left of [S], click on [S-Glass], and then press [OK].Then click the [Develop] button to the right of [Commercial Glass], and the chemical composition of S-glass is shown in the composition column.
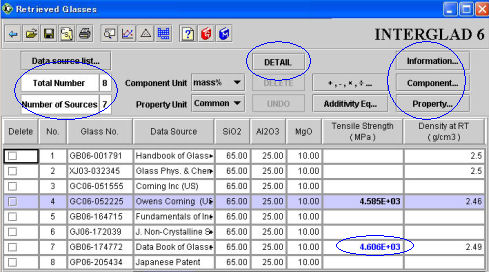
Click the [Search] button to initiate the retrieval and a the retrieved glasses window will quickly appear. The window shows that the [Total Number] of retrieved glasses is 8 while the [Number of Sources] is 7. This means that the eight retrieved glasses are derived from seven data sources.
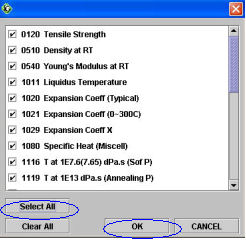 Now, press the [Property...] button at the top right of the retrieved glasses
window, and a list of all properties of the retrieved glasses appears in
the [Property] list box. Press the [Select All] button and then [OK], and
the values of all properties of the retrieved glasses are shown in the
retrieved glasses table. The [Information...] and [Composition...] buttons function in the same way.
Now, press the [Property...] button at the top right of the retrieved glasses
window, and a list of all properties of the retrieved glasses appears in
the [Property] list box. Press the [Select All] button and then [OK], and
the values of all properties of the retrieved glasses are shown in the
retrieved glasses table. The [Information...] and [Composition...] buttons function in the same way.Occasionally, values highlighted in blue may be found. Such values are subject to certain conditions which may be ascertained from the detail windows. Information on commercial S-Glasses has now been assembled.
Next, information will be sought on glasses having chemical compositions close to that of S-Glass.
Return to the query specification window and change the content of each component so as to be 2% less than the [%min] value of S-glass and 2% more than the [%max] value of S-Glass. Data will then be collected covering a 4% spread. More explicitly, conduct the search as follows:
SiO2: 63 - 67mass%
Al2O3: 23 - 27mass%
MgO: 8 - 12mass%
Note: The percentage content of each component is displayed to two orders in fixed-point decimal representation. The content of trace components of less than 100 ppm is represented in ppm.
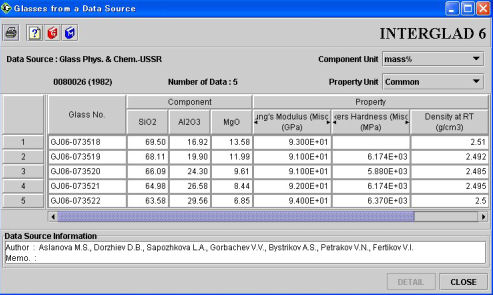 Now, click the [Search] button. Data on 59 glasses (34 data sources) are shown in the retrieved glasses window. Press the [Information...] button at the upper right of the window. The information list box is activated. Clicking the checkboxes next to [Year] and [Data Source] to show them in the retrieved glasses table. In addition, press the [Property...] button, select 'Young' s Modulus' and 'Vicker' s Hardness' and press [OK]. The values of the selected properties are shown in the retrieved glasses table.
 The 24th glass, GJ06-073521, with its comparatively high Young's modulus and Vicker' s hardness values is interesting, and so the source of the data is investigated. Select this glass by clicking on the line in which it is displayed, then click the [Glass from a Data Source] icon at the top left of the window. A list of 5 glasses from a single data source appears and information on the all glass used for the research can be obtained.
Note: Ver. 6 of INTERGLAD introduces the [Commercial Glass] function for the first time. In former versions, the information on commercial glasses was derived only from catalogs.
 (2) Presumed composition of commercial glasses
Composition values are not usually given in commercial glass data. However, the composition may be surmised from patent data. Here, the presumed composition of PD200 of Asahi Glass Co. Ltd. will be determined.
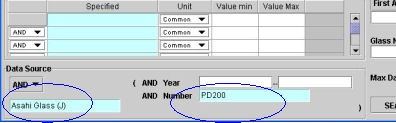
 Press the [Reset] button in the query specification window and double-click the light blue area in the [Data Source] column. The [Data Source] dialog box is activated. Click the mark to the left of 'Catalogue' to invoke the submenu. Click 'Asahi Glass(J)'
in the submenu, then press the [OK] button. Click the [Number] cell in
the same column to invoke the submenu, click 'PD200' in the submenu, and
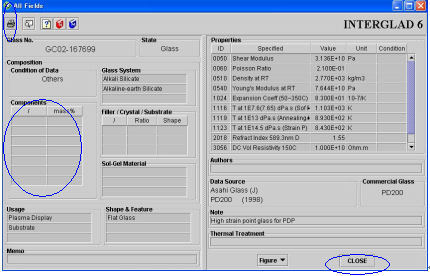
press the [OK] button. And press the [Search] button. Then, a detailed
window (glass No.167699) that the composition column is an empty is displayed.
This page is printed by using the [Print]. The window is shut and is returned
to the retrieval window. mark to the left of 'Mechanical, Physical' to invoke the submenu. Click
the mark to the left of 'Density, Porosity' in the submenu. Click the mark for 'Density' in the second submenu. Then, referring to the values
just printed from the details window, click '0510 Density at RT' in the
third submenu, and press the [OK] button to specify the property item.
The 2.7(g/cm3) (from the detail window printout) is input to the min% column,
and 2.9(g/cm3) is input to the max% column.
Press the [Reset] button in the query specification window and double-click the light blue area in the [Data Source] column. The [Data Source] dialog box is activated. Click the mark to the left of 'Catalogue' to invoke the submenu. Click 'Asahi Glass(J)'
in the submenu, then press the [OK] button. Click the [Number] cell in
the same column to invoke the submenu, click 'PD200' in the submenu, and
press the [OK] button. And press the [Search] button. Then, a detailed
window (glass No.167699) that the composition column is an empty is displayed.
This page is printed by using the [Print]. The window is shut and is returned
to the retrieval window. mark to the left of 'Mechanical, Physical' to invoke the submenu. Click
the mark to the left of 'Density, Porosity' in the submenu. Click the mark for 'Density' in the second submenu. Then, referring to the values
just printed from the details window, click '0510 Density at RT' in the
third submenu, and press the [OK] button to specify the property item.
The 2.7(g/cm3) (from the detail window printout) is input to the min% column,
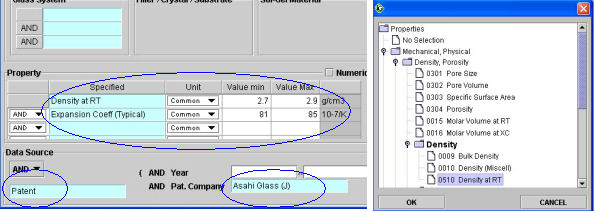
and 2.9(g/cm3) is input to the max% column. Moving to the second line of the [Property] column, double-click in the light blue [Specified] cell. The [property] dialog box is activated. Click the
mark to the left of 'Thermal' to invoke the submenu. Click the mark to the left of 'Thermal Expansion' in the submenu. Click the mark for 'Linear Expansion Coeff' in the second submenu and, referring
to the numerical values from the printed details window, click '1020 Expansion
Coeff (Typical)' in the third submenu, then press the [OK] button to specify
the property item and put 81 into the min% column, and 85 into the max%
column.Next, 'Patent' is specified in the [Data Source] column. 'Asahi Glass(J)' is specified in the [Pat. Company] column, then the [Search] button is pushed.
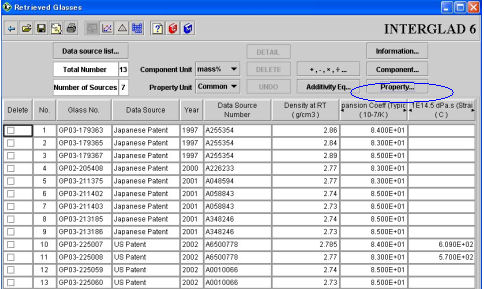
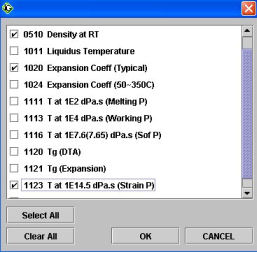 To examine other properties described in the details window, the [Property...]
button in the upper right part of the retrieval result list is clicked
and the [Property ID] small window is displayed. The check box of '1123
T at 1E14.5 dPa・s(Strain P)' is clicked. [OK] is pushed and 'Strain Point'
is added to the retrieval results list. It is seen that the glass of the
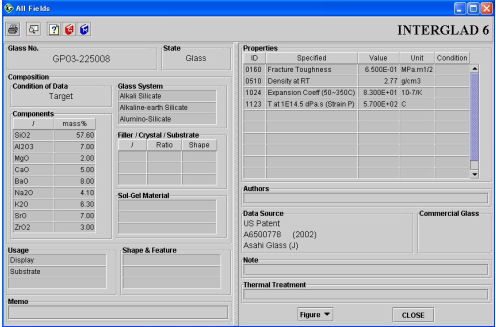
same strain point as glass No.167699 is No.225008. A detailed window in
which the glass composition is described is displayed by double-clicking
the line on which that glass appears.
To examine other properties described in the details window, the [Property...]
button in the upper right part of the retrieval result list is clicked
and the [Property ID] small window is displayed. The check box of '1123
T at 1E14.5 dPa・s(Strain P)' is clicked. [OK] is pushed and 'Strain Point'
is added to the retrieval results list. It is seen that the glass of the
same strain point as glass No.167699 is No.225008. A detailed window in
which the glass composition is described is displayed by double-clicking
the line on which that glass appears. It is also possible to confirm the glass composition on the retrieval result list by using the [Component...] button there.
 (3) Searching for image data
The image data stored in INTERGLAD Ver. 6 are temperature- viscosity dependence, temperature-diffusion coefficient dependence, temperature-electrical conductivity (DC resistivity, AC resistivity) dependence and the optical wavelength dispersion of the refractive index. These data can be shown as figures using the coefficients or constants of the characteristic equation for each property. On the other hand, there are thermal expansion curves as well as transmission, absorption, reflection and emission spectra in the form of high-density numerical data.
Here, we introduce an example of the temperature-viscosity dependence of fluoride glasses.
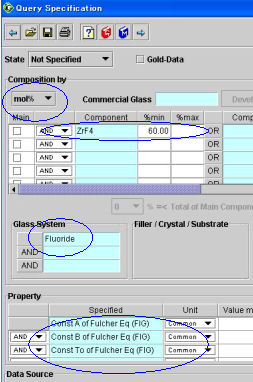
Press the [Reset] button in the query specification window and select 'mol%' by clicking the [mass%] pull-down menu. Input 'ZrF4' in the light blue [Component] cell in the [Composition] column and enter 60 in the [%min] cell.
Next, input ' Fluoride' in the [Glass System] cell, double-click in the [Property] cell, and select 'Thermal' , 'Viscosity' and '1231 Const A of Fulcher Eq (Fig), in that order, using the menu, specifying '1231' , and clicking [OK]. Specify '1232' and '1233' in the other boxes and then click the [Search] button.
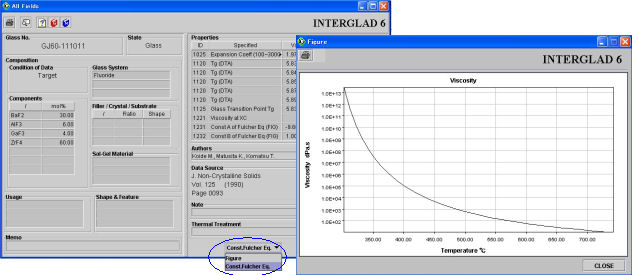
Three sets of data from three data source are shown in the retrieved glasses window. Because the three constants for Fulcher' s equation necessary for displaying figures are collected as numerical values for the 1st and 2nd glasses, the result is a figure. A figure showing the temperature dependency of the viscosity appears when [Const. Fulcher's Eq] is clicked after the [Figure] pull-down menu to the lower of the detail window for the 2nd glass is opened.
Note: It is convenient to use [Glass System] for roughly specifying a glass composition, because the glass system (Alumino-Silicate, Boro-Silicate, Fluoro-Phosphate, etc.) is recorded for every glass. However, because there is no absolute standard for such classifications, and the attributions are not always correct, one should not be overly confident about this approach.
By way of example, here we look at the relationship between density and refractive index of glasses containing more than 10 mass% of PbO.
Press the [Reset] button in the query specification window and double-click the light blue [Component] area in the [Composition] column. The [Component] dialog box is activated. Click the
mark to the left of 'Oxide' to invoke the submenu. Click the mark next to 'M(2+)Oxide' in the submenu, click 'PbO' in the second submenu,
then press the [OK] button. After PbO is entered in the cell of the query
specification window, input 10 mass% in the cell to right.Next, double-click in the light blue [Specified] cell in the [Property] column. The [property] dialog box is activated. Click the
mark to the left of 'Mechanical, Physical' to invoke the submenu. Click the mark to the left of 'Density, Porosity' in the submenu. Click the mark for 'Density' in the second submenu, and click '0510 Density at RT' in the third submenu, then press the [OK] button to specify the property item.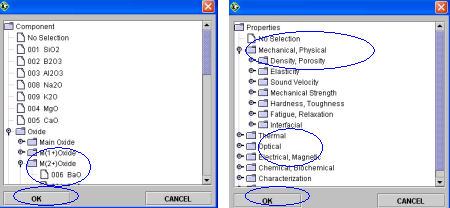 Click the marks for 'Optical' , 'Refraction' , 'Refractive Index Visible' , and
'2017 Refractive Index 587.6 nm d' , in that order, using the list box.
Then press [OK] in order to specify the property items. Check the checkbox
[Numerical] at the top right of the property column, because the information
to be needed is numerical values only in the present case.
Click the marks for 'Optical' , 'Refraction' , 'Refractive Index Visible' , and
'2017 Refractive Index 587.6 nm d' , in that order, using the list box.
Then press [OK] in order to specify the property items. Check the checkbox
[Numerical] at the top right of the property column, because the information
to be needed is numerical values only in the present case.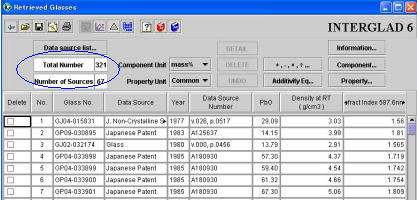 Now, click the [Search] button. Data on 322 glasses from 67 data sources are shown in the retrieved glasses window. Click the [Data source list] button at the upper left of the window, a [Data Source] list box showing 67 data source appears.
Next, the method of plotting the relationship between density and refractive index is explained.
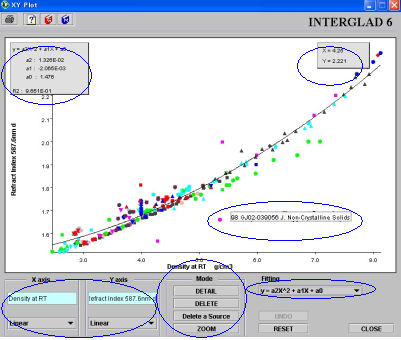 Click the [X-Y plot] icon at the top left of the retrieved glasses window in order to display the X-Y Plot window. Double-click in the [X axis] cell in the window. The 'component and property'
list box appears. Click the mark to the left of 'Property' . All property items belonging to the 322 glasses are shown. Select '0510 Density RT' in the list by clicking the checkbox, then press [OK] to verify it.
Click the [X-Y plot] icon at the top left of the retrieved glasses window in order to display the X-Y Plot window. Double-click in the [X axis] cell in the window. The 'component and property'
list box appears. Click the mark to the left of 'Property' . All property items belonging to the 322 glasses are shown. Select '0510 Density RT' in the list by clicking the checkbox, then press [OK] to verify it.Specify '2017 Refractive Index 587.6 nm d' for the Y axis in the same manner. An X-Y plot of the retrieved data appears.
For curve fitting, use the [Fitting] pull-down menu at the bottom right of the window. Select among linear, quadric, and cubic curves by clicking. A fitting curve is drawn on the X-Y plot according to the function selected. In the present example, a quadric curve is probably the most adequate fit. The regression curve equation, its coefficients and the degree of contribution R2 are shown in the small column. Place the mouse pointer on any plot-point in the graph. The glass number and its data source appear. The scales of the X and Y axes can be changed independently from linear (the default) to inverse, logarithmic or reverse scales. The scale increases from right to left in reverse scale.
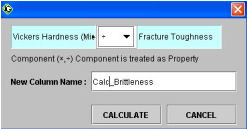
 The brittleness of a glass is expressed by the ratio of the Vicker' s hardness to the fracture toughness. This relationship is investigated for silicate glasses as follows.
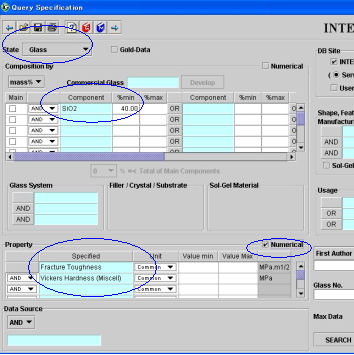
Select 'Glass' in the [State] pull-down menu at the top left of the query specification window, specify 'SiO2' in the light blue [Component] cell, then input 40 (mass%) in the [%min] cell to the right of 'SiO2' .
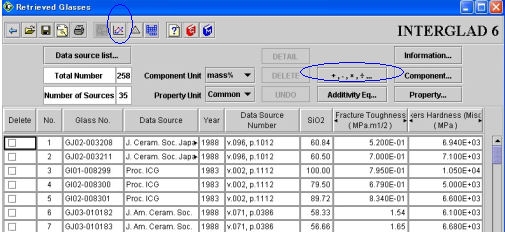
Specify '0160 Fracture Toughness' and '0170 Vickers Hardness (Miscell)' in the two cells of the [Property] column, then click on the [Numerical] checkbox. The relationship between the two items is 'and' . Press the [Search] button. Two hundred fifty-eight glasses from 35 data sources are retrieved.
 Press the[
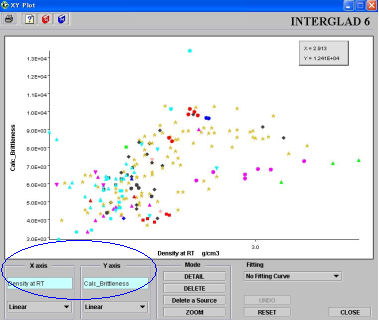 Display the X-Y plot window by clicking the [X-Y plot] icon, and specify '0010 Density at RT' for the X axis and 'Vickers Hardness/ Fracture Toughness' for the Y axis. The X-Y plot appears. It is found that the plotted lines fall into two groups, one belonging to soda-lime silicate glasses, and the other belonging to glasses of another system.
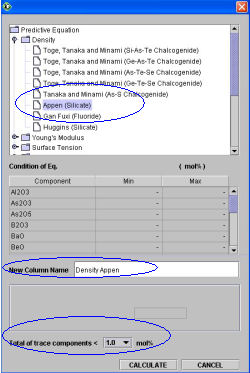 (6) Investigation of additivity equations
Comparison of the data recorded in INTERGLAD (measured values) with predicted values calculated by use of an additivity equation is outlined here.
Select 'Glass' after clicking [State] pull-down menu at the top left of the query specification window, input 'SiO2' in the top cell of the [Composition] column, 30 (mass%) in the [%min] cell and 60 (mass%) in the [%max] cell. Then input 'TiO2' and 10 (mass%) in the [%min] cell.
Input '0510 Density at RT' in the [Specified] cell of the [Property] column, and click the [Numerical] checkbox at the top right of the [Property] column. Press the [Search] button, and 626 glasses from 99 data sources appear.
A list of additivity equations appears in a dialog box after clicking on [Additivity Equation] button. Double-click 'Appen' in the [Density] sub-menu.
If impurities such as refining agents are present, it is possible to calculate up to total 1mol% by inputting the numerical value into [Total of trace components<] in the window.
When '1.0' is put in the column, and the [Calculate] button at the bottom of the box is pushed, the calculation is executed.
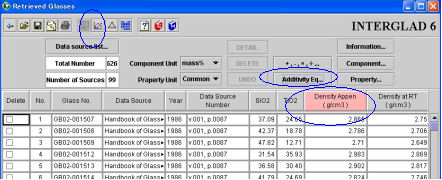
The result of the calculation is shown in a column that is newly added to the retrieved glasses table. Click the [X-Y plot] icon, and then input '0510 Density at RT' for the X axis and 'p0010-00 Density' for the Y axis. An X-Y plot appears.
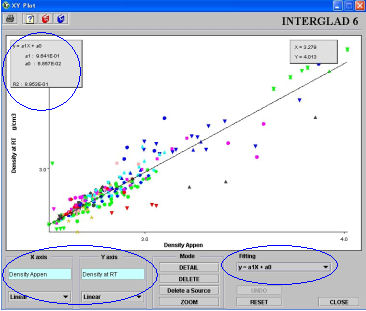 Click the linear function, y=a1x+a0, in the [Fitting] pull-down menu at the bottom right of the window. A
straight line appears on the plot. The constants, a1 and a0, and the regression coefficient R2 of the function are shown in a small box at the top left. The closer a1 , a0 and R2 are to 1, 0 and 1, respectively, the greater the accuracy of the prediction. Thus, the accuracy of the additivity equation can be verified by this method. A '*' appears in the cell of the calculation result column if a property cannot be calculated by the selected additivity equation.
Click the linear function, y=a1x+a0, in the [Fitting] pull-down menu at the bottom right of the window. A
straight line appears on the plot. The constants, a1 and a0, and the regression coefficient R2 of the function are shown in a small box at the top left. The closer a1 , a0 and R2 are to 1, 0 and 1, respectively, the greater the accuracy of the prediction. Thus, the accuracy of the additivity equation can be verified by this method. A '*' appears in the cell of the calculation result column if a property cannot be calculated by the selected additivity equation. Numerical values (±1.000 - ±9.999) from 1 to less than 10 are represented with fixed zero points, while in other cases they are represented using indices (e.g. 2.345E+07).
| BACK | NEXT |