2. Prediction of properties
The prediction of properties or the design of a glass composition is possible by the following two methods.
1) Prediction by multiple regression analysis
2) Prediction by additivity equation
The INTERGLAD data which can be used in multiple regression analysis have been limited to those for which [State] of the glass was classified as 'Glass' .
 The glass Corning code 9863 is highly transmissive of UV rays, and
is a colored barium phosphate glass containing traces of CoO and NiO. However,
its optical properties have not been reported. Here, a prediction of the
optical properties of the glass is made by referring to the case of a transparent
glass for which the composition is close to that of code 9863. The glass
composition in mass% is as follows.
The glass Corning code 9863 is highly transmissive of UV rays, and
is a colored barium phosphate glass containing traces of CoO and NiO. However,
its optical properties have not been reported. Here, a prediction of the
optical properties of the glass is made by referring to the case of a transparent
glass for which the composition is close to that of code 9863. The glass
composition in mass% is as follows. P2O5: 70.03 mass%, BaO: 18.78, Al2O3: 5.70, CaO: 5.49.
Open the [Query Specification for Regression Analysis] window by clicking the [Go Prediction] button in the initial screen and then clicking the [Regression Analysis] button.
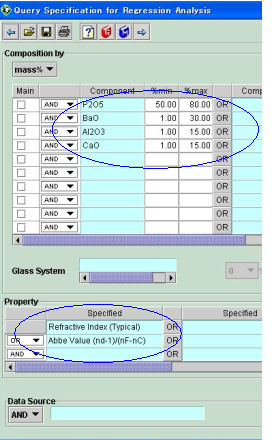
Next, serially enter each component and its minimum and maximum content in the [Component], [%min] and [%max] cells of a given line.
P2O5: 50 - 80 mass%, BaO: 1 - 30, Al2O3: 5 - 11, CaO: 5 - 11
Link all four components to each other with [AND].
Double-click in one of the light blue [Property] cells and specify '2010 Refractive Index (Typical)' . Click on [AND] to the left in the next line to open a pull-down Boolean menu. Select [OR] in the menu and then input '2051 Abbe Value (nd-1)/(nF-nC)' .
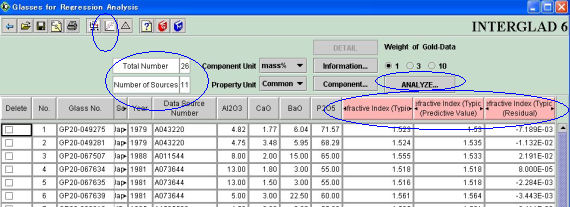
Click the [Search] button. The [Glasses for Regression Analysis] window appears. It will be seen that the total number of glasses is 26 and the number of data sources is 11.
Note: It is preferable to retrieve with 'AND' , because the relation between plural properties is more reliable. But 'OR' is selected in the present case, because unfortunately no data is retrieved using 'AND' .
 ], [Additivity Eq.], [Delete] and [Undo] do not, making it different from
the retrieved glasses window in this respect. Data cannot be deleted directly
from the table in the [Glasses for Regression Analysis] window, but this
can be accomplished by using the checkboxes in the delete column.
], [Additivity Eq.], [Delete] and [Undo] do not, making it different from
the retrieved glasses window in this respect. Data cannot be deleted directly
from the table in the [Glasses for Regression Analysis] window, but this
can be accomplished by using the checkboxes in the delete column.  Click on [Analyze...]. Confirm the check mark in the checkbox of the
specified property in the dialog box, then click [OK]. The regression analysis
begins. The results of the analysis are shown in two new columns, 'Predictive Value' and 'Residual' for each property.
Click on [Analyze...]. Confirm the check mark in the checkbox of the
specified property in the dialog box, then click [OK]. The regression analysis
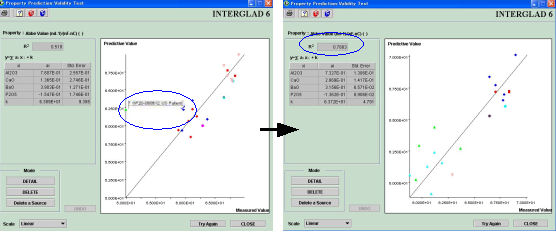
begins. The results of the analysis are shown in two new columns, 'Predictive Value' and 'Residual' for each property.Click the [Validity Test] icon in order to confirm the results of the analysis. After clicking on the '2051Abbe Value (nd-1)/(nF-nC)' radio-button in the dialog box, click [OK]. A validity test window appears.
A comparative X-Y plot with the measured values (INTERGLAD data) on the X-axis and the predicted values (prediction by regression analysis) on the Y-axis is displayed on the window.
Almost all the plot-points lie close to the line X=Y except one. In order to investigate that point, place the mouse pointer over it, right-click, then click 'Detail' . A detail window relating to the glass appears. Note that this glass contains 12 mass% Sb2O3 and 6 mass% PbO. Close the detail window, and right-click on the plot-point in the validity test window, then click [Delete] in order to remove the anomalous point.
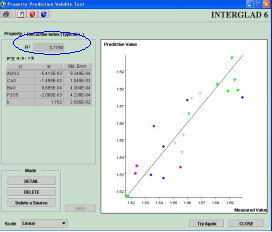
Click the [Close] button to return to the [Glasses for Regression Analysis] window. After clicking the [Validity Test] icon, click on the '2010 Refractive Index (Typical)' radio-button in the dialog box, then click [OK]. The validity test window appears. The measured values of the 2010 refractive index are on the X-axis and the predicted values of the 2010 refractive index are on the Y-axis of the X-Y plot. The points are clustered near the Y=X line, so it is presumed that although R2, at 0.770, is slightly small, the result of the regression analysis is fairly reliable.
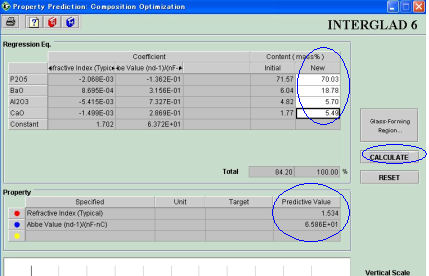
 Return to the [Glasses for Regression Analysis] window by closing the validity test window. Reverse the color of any line by clicking on it, then clicking the [Composition Optimization] icon to conduct the specified property prediction. Press the [OK] button in the [Specify Target] dialog box, but do not input anything in the cell. The [Property Prediction: Composition Optimization] window appears. Enter the glass composition to be predicted (P2O5: 70.03, BaO: 18.78, Al2O3: 5.70, CaO: 5.49 in mass%) in the cells of the [Content - New] column of the regression equation table, and press the [Calculate] button.
 The following property values are shown in the property table.
Refractive index : 1.534,
Abbe Value (nd-1) /(nF-nC): 65.86
Thus, the property values can be predicted.
An alumino-silicate glass having a thermal expansion coefficient of 85×10-7/K and with a softening point of 700
 is designed by means of multiple regression analysis, as follows.
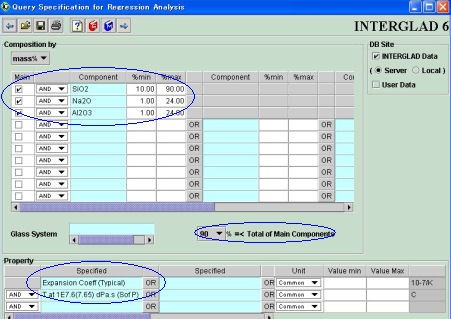
Click the [Go Prediction] button in the main window, and then click the [Regression Analysis] button in the prediction menu dialog box. The [Query Specification for Regression Analysis] window is opened.
Input the following in the cells of the [Component], [%min] and [%max] columns:
SiO2 : 10 - 90 mass%
Na2O: 1 - 24 mass%
Al2O3: 1- 24 mass%
Click all the [Main] checkboxes to the left of the 'SiO2' , 'Na2O' and 'Al2O3' cells in order to specify the three components as the main components, and then select 90% in the [Total of Main Components] pull-down menu as the sum of the three components.
Select and input '1020 Expansion Coefficient (Typical)' from the list box which appears after double-clicking the top light-blue cell under [Specified] in the Property column. Then, input '1116 T at 1E7.6 dPa·s (Sof. P)' in the same manner in the cell below. These two properties are linked with [AND].
Click the [Search] button. The [Glasses for Regression Analysis] window appears after a few moments. Thirty-one glasses from 19 data sources are shown in the window.
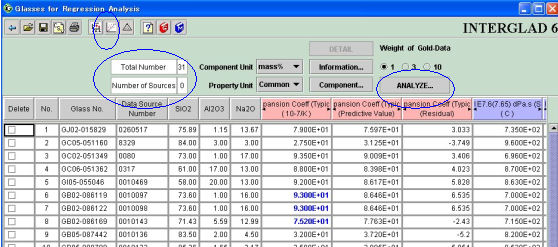
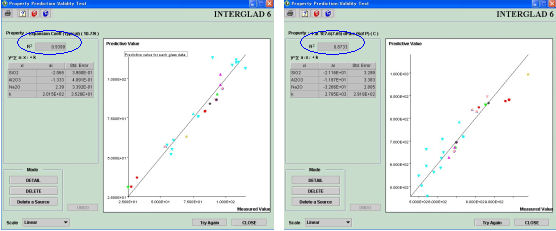
Click the button next to 'Thermal Expansion Coeff. (Typical)' in the dialog box which appears after clicking the [Validity Test] icon, and then press [OK]. An X-Y plot in which the measured value is assigned to the X-axis and the predicted value is assigned to the Y-axis is shown. Almost all points are crowded in the vicinity of a line Y = X, and R2 = 0.9399 means that the prediction is highly reliable for this alumino-silicate system.
Return to the [Glasses for Regression Analysis] window by clicking the [Close] button at the bottom-right. Click again on the [Validity Test] icon. Click the 'T at 1E7.6 dPa·s (Sof. P)' button, and display the validity test window. An R2 of 0.8733 means that the prediction is reliable for this alumino-silicate system. Now, return to the [Glasses for Regression Analysis] window by clicking the [Close] button at the bottom-right.
Refer to the next chapter concerning standard error and regression coefficient R2 .
 The design of a glass with thermal expansion coefficient and softening
point of 85×10-7/K and 700 , respectively is determined as follows.
The design of a glass with thermal expansion coefficient and softening
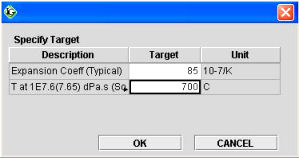
point of 85×10-7/K and 700 , respectively is determined as follows. Click on a glass which has properties close to that of the glass to be designed, thereby changing the color of its line. Then click on the [Composition Optimization] icon. Input 85 as the target value in the 'Expansion Coefficient (Typical) ' cell and 700
(or 973 K) as the target value in the 'T at 1E7.6 dPa・s (Soft. P) ' cell in the specify target dialog box, and then click [OK].The [Property Prediction : Composition Optimization] window appears. Press the [Calculate] button at the center-left of the window. A glass composed of three components in equal proportions is described in the new column, and the calculated property values are displayed in both a table and a graph.
The plot on the graph shows the difference [(Predictive) - (Target)], with both points falling in negative territory, so it is necessary to change the glass composition in order to increase both values. Increase the content of Al2O3 and the content of Na2O by adjusting the property coefficients, and press [Calculate]. Continue the calculations while watching the movement of the plot. Finally, a glass is obtained as follows.
Glass composition in mass%: SiO2=59.88, Na2O=16.67, Al2O3=23.45
Thermal expansion coefficient = 86.46×10⁻⁷ /K
Softening point =693.1
.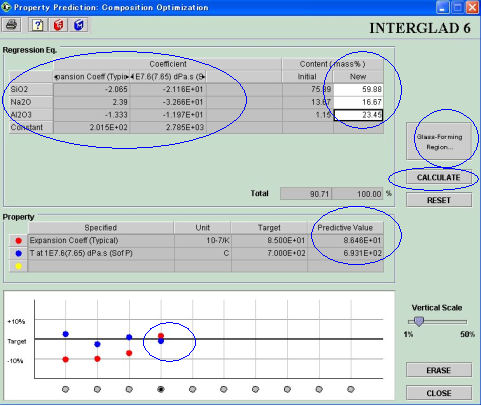
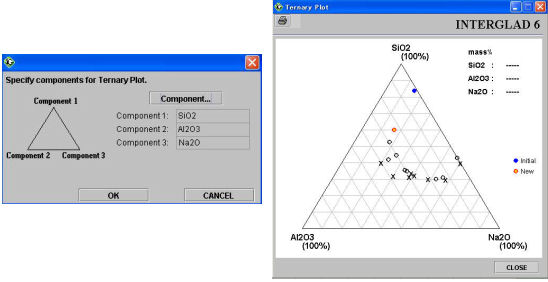
Press the [Glass-Forming Region] button at the top right of the window, and a dialog box appears. Double-click the cells in the dialog, and input SiO2, Na2O and Al2O3 successively, then click [OK]. A ternary diagram appears. This confirms that the chemical composition of the designed glass lies within the glass-forming region.
 (3) Prediction of property by means of additivity equation
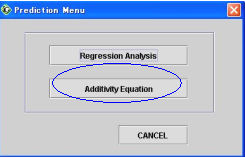
Calculation of the mean dispersion of an alkali zinc silicate glass. Click the [Go Prediction] button on the main window, then select [Additivity Equation] in the dialog box. A [Property Prediction : Additivity Equation] window appears. Select [Mean Dispersion] in the list at the right, and double-click [Huggins]. Then, enter the following values in the cells of the component column.
SiO2: 59.48 mass% , Na2O: 15.34, ZnO: 25.18
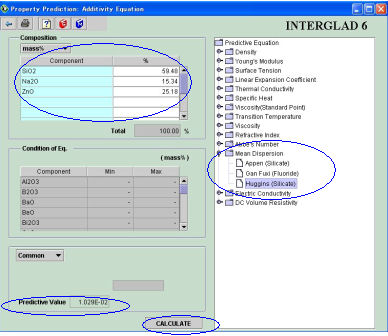
Press [Calculate]. 1.029×10⁻² immediately appears. For reference, input the above glass composition, and conduct a retrieval operation, specifying items in the following order: optics/ refractive index/ mean dispersion/ mean dispersion F-C.
The mean dispersion of the retrieved glass, GB02-019152, is 1.014×10⁻², a calculated value which is very close to the measured value.
| BACK | NEXT |