2. Retrieval function
2.1 Query specification window
The retrieval of data and analysis of the retrieved data can be conducted via this window or dialog box. The retrieval conditions are specified using this window.
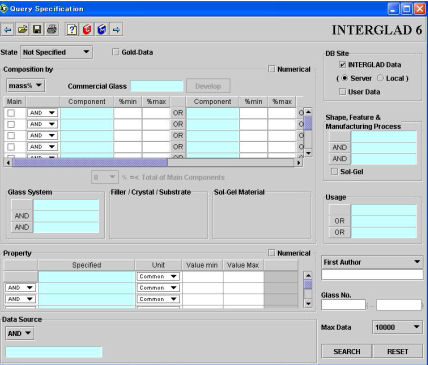
(1) Selection of database
Choose the database to be used - INTERGLAD data or user data. It is also possible to access both databases simultaneously. The latest version of the INTERGLAD data on the server or the INTERGLAD data on the CD-ROM or the user's personal computer can be selected. A default selection can be made by setting the appropriate user environment preference.
In the Applet version, only data on the server can be used.
(2) Specification of retrieval conditions
Retrieval conditions can be set to determine the extent and nature of the glass data retrieved. Retrieval operation is conducted on the assumption that each conditional is linked by the operator AND.
1) State
Select Not-Specified in order to scan all the stored data.
Choose among Glass-General, Melt and Non-Vitrified to limit the search to a particular state of glass. Under Glass-General a single sub-state can be selected form among Glass (usual), Glass-Ceramics, Composite, Modified glass and Thin Film. Glass-General is set as the default.
2) Gold-Data
Highly reliable glass compositions are distinguished as Gold-Data and it is possible to specify Gold-Data only (as opposed to normal data) to limit retrieval.
The addition of Gold-Data will take place through the confirmation of individual glass data. Glass numbers with an 'R' attached denote Gold-Data, while a yellow star identify a Gold-Data glass on an X-Y or ternary plot.
3) Composition
a) Numerical
If the [Numerical] checkbox is checked, non-numerical data concerning glass components will be ignored.
b) Unit
The unit of glass composition can be chosen from among mass%, mol% and at% . The default is mass%, however this can be changed in the [User Environment] preferences.
c) Commercial Glasses and [Develop] button
Commercial glasses are listed in a dialog box, which is opened by clicking in the [Commercial Glass] cell. A commercial glass can be selected from the list and the [Develop] button to the right of [Commercial Glass] clicked to display the chemical composition of the commercial glass in the Component column. When more than one composition exists for a listed commercial glass, composition is shown as a range from %min (minimum value) to %max (maximum value). The composition column and the commercial glass are connected by the operational link 'OR'.
d) Chemical components
Components are classified into nine groups: Oxide, Fluoride, Chloride, Bromide, Iodide, Element, Sulfide etc, Raw Materials, Fillers (for composite). A component can be specified from the list of the dialog box opened by clicking on a blue cell in the component column. When either %min or %max is selected, non-numerical compositional data denoted by an asterisk (*) are not retrieved.
Glasses without the component can be extracted by inputting '-1' in the [%min] cell. This is convenient when even small amounts of an unwanted component are retrieved.
RmOn can be used to specify all the member compounds of a particular chemical component group. When selected, every compound belonging to the group is connected by the operational 'OR'. In such cases, %min and %max limit the aggregate content of the group.
The groups are as follows:
| R2O | Li2O, Na2O, K2O, Rb2O, Cs2O, R2O |
| RO | MgO, CaO, SrO, BaO, RO |
| R2O3 | Al2O3, Fe2O3, Cr2O3, R2O3 |
| RO2 | TiO2, ZrO2, HfO2, RO2 |
| R2O5 | P2O5, V2O5, Nb2O5, Ta2O5, R2O5 |
| RO3 | MoO3, WO3, RO3 |
| RE2O3 | Ce2O3, Pr2O3, Nd2O3, Pm2O3, Sm2O3, Eu2O3, Gd2O3, Tb2O3, Dy2O3, Ho2O3, Er2O3,Tm2O3, Yb2O3, Lu2O3, Sc2O3, Y2O3, La2O3, RE2O3 |
| AnO2 | ThO2, PaO2, UO2, NpO2, PuO2, AmO2, CmO2, BkO2, CfO2, EsO2, FmO2, MdO2, NoO2,LrO2, AcO2, AnO2 |
AND, OR and NOT can be selected for each line
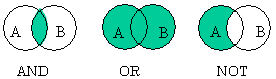
in the component column to specify relation- ships
(see right-hand figure).
[Component A] AND [component B] specifies
the presence of both A and B.
[Component A] OR [component B] specifies the presence of either A or B. [Component A] NOT [component B] specifies the presence of A and the absence of B.
The processing order when there are two or more AND, OR, and NOT conditions is as follows:
[1] ANDs are assessed collectively, and when AND and OR are in vertical relationship (i.e., applying to two or more components) OR is assessed subsequent to AND.
[2] When OR is in a horizontal relationship (i.e., applying to an alternative to a given component), it is judged that parentheses are attached, and the full expression is given priority processing.
When two or more components are input to a line in which NOT
is put with OR, it is necessary to know that:
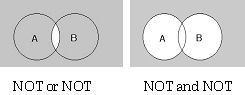
NOT(A) or NOT(B) = NOT(A and B)
Moreover, when two or more NOTs are used in vertical relationship,
the following is meant:
NOT(A) and NOT(B) = NOT(A or B)
The total percentage of main components can be selected using the [
When the main component is specified, OR and NOT in the line cannot be used. However, the horizontal OR can be used to specify an alternative.
f) Glass System
A glass system can be specified from the list box activated by double-clicking in a light blue cell in the [Glass System] column.
g) Filler/Crystal/Substrate
When [Composite] is specified as the [State], it becomes possible to specify fillers. The filler type can be selected from the dialog box opened by double-clicking in a light blue cell in the [Filler/Crystal/Substrate] column.
When [Glass Ceramics] is specified as the [State], it becomes possible to specify crystals. The crystal type can be selected from the dialog box opened by double-clicking in a light blue cell in the [Filler/Crystal/Substrate] column.
When [Thin Film] is specified as the [State], it becomes possible to specify a substrate. A substrate type can be selected from the dialog box opened by double-clicking in a light blue cell in the [Filler/Crystal/Substrate] column.
h) Sol-Gel Raw Material
Choice of [Sol-Gel Material] becomes possible when the [Sol-Gel] checkbox in the [Shape…] column is checked or [Sol-Gel] is specified in a light blue cell in the column. The material can be selected from the dialog box opened by double-clicking in a light blue cell in the [Sol-Gel Material] column.
4)Property
Properties can be selected from the dialog box opened by double-clicking in any cell of the [Property] column. Bold-face items in the box refer to the table data. (See Chapter 5 / 5. Table data)
[AND] or [OR] can be specified for each item in the [Property] column.
a) Numerical
When the [Numerical] checkbox is checked, non-numerical data denoted by an asterisk (*) are not retrieved.
b) Unit
The unit system -Common, SI, CGS or PSI- can be separately specified for each property. (The default unit is Common, but this default can be changed using the User Environment preferences accessed through the main window. A '#' sign appearing in the unit column denotes that the property is recorded in some unit which cannot be converted.
c) Specification of property group
By choosing an item higher on the [Property] dialog list, plural properties subordinate to the chosen property is used for retrieval, and the data of each properties be shown in the retrieved glasses table.
d) Electric conductivity, AC resistivity, and DC resistivity
If any one among electric conductivity, AC resistivity and DC resistivity is specified as a retrieval condition, the retrieval for the other two properties will be conducted together according to the table below. When plural properties are retrieved, single data is listed in the [Glasses for Regression Analysis] window according to the priority levels in the following table.
|
Specified item
|
Priority 1
|
Priority 2
|
Priority 3
|
|
Electric conductivity
|
Electric conductivity
|
Reciprocal of AC resistivity
|
Reciprocal of DC resistivity
|
|
AC volume resistivity
|
AC volume resistivity
|
Reciprocal of conductivity
|
DC volume resistivity
|
|
DC volume resistivity
|
DC volume resistivity
|
Reciprocal of conductivity
|
AC volume resistivity
|
Items are chosen from the list opened by double-clicking in a light blue cell in the [Shape, Feature & Manufacturing Process] column.
6) Sol-Gel button
When this button is on, specification of sol-gel raw materials becomes possible.
7) Usage
Usage is specified by choosing from the list opened by double-clicking in a light blue cell in the [Usage] column. When two or more usages are specified, they are connected by the [OR] operator.
8) Author
A data-source author’s name is inputted by typing. First author or any author may be specified.
9) Data Source
A specific data source type may be specified by choosing from the list opened by double-clicking in a light blue cell in the [Data Source] column. The data source can be specified at any level of the classification scheme. Exclusion of a particular data source is also possible by specifying the NOT operator.
a) Data source name
Any category (data book, journal, proceedings, patent, catalogue and user's data), or any subordinate classification can be selected in the data source dialog box. The name of a particular data book [Book], academic journal [Journal], proceedings [Proceeding], European patent, US patent or Japanese patent [Patent], or the company name [Catalogue] may be specified.
b) Year
The year of publication of a data source can be specified. Input four digits in the [Year] cell. Japanese years must be converted to years of the Christian calendar in the case of Japanese patents. A single year can be specified by inputting the same figure as a right and left column.
c) Number
The specifying method for a number changes as follows according to the category.
| Data book: | The volume number of a data book can be specified by choosing [Book]. Input the volume number in three digits such as 00B or 002. |
| Journal and Proceedings: | When [Journal] or [Proceeding] are chosen, their volume numbers can be similarly specified. The three-digit volume number (e.g. 002) may also be combined with a four-digit page number (e.g. 0035) as a seven-digit number in the order 0020035. When dealing with a combined volume, only one volume number is used. For example, input either 059 or 060 for Vol. 59-60. Occasionally there are five digits in the number of pages. In such cases, page 10000 is shown by "t" instead of the first 10. Similarly, page 11000, page 12000 and page 13000 are shown respectively by "e", "w" and "h". |
| Patent: | When either [European patent], [US patent] or [Japanese patent] is chosen, the patent number can be specified. Input 'A' (appears automatically) followed by the six-digit patent number for a Japanese patent or the seven-digit patent number for a European or US patent. |
| Catalogue: | When [Company] is chosen, the company's glass code number can be specified. Select the appropriate glass code in the dialog box opened by double-clicking on the [Number] cell. |
BE: Belgium; DD: former Democratic Republic of Germany; DE: Germany (Federal Republic of)
FR: France; GB: Great Britain; J: Japan; KR: Korea (Republic of); NL: Netherlands; PT: Portugal
RU: Russia; SU: former Soviet Union; US: United States of America; IT: Italy
d) Patent Company (company to which patent belongs)
This name is specified only in cases where the data source is [Patent]. Select a company name in the list box opened by double-clicking the light blue cell.
10) Glass number (six-digit numeric portion only)
If a glass number is input, the retrieved glass is shown in the detail window. A second glass number may be input in the right-hand cell when more than one glass is needed.
11) Max Data
Max Data specifies the upper limit to the number of glasses retrieved. The default is 10, but this number can be changed by changing the user environment preferences.
12) [Search] button
The retrieval operation is conducted.
13) [Reset] button
The query specification window is initialized by clicking [Reset] button.
[Explanation of functions]
(1)
 [Save] icon
The conditions governing any retrieval operation may be saved under a specified file name. The file-type extension '.iga' is appended automatically. 'Query' is offered as the default file name, but this can be changed to any name desired.
(2)
 [Open] icon
 A saved retrieval conditions file '.iga' can be opened in the query specification window.
(3)
 [Print] icon
 The displayed window is printed as is by the chosen printer.
Data retrieval is conducted based on the retrieval conditions specified on the query specification window, and retrieved glasses are displayed in the order of their glass numbers.
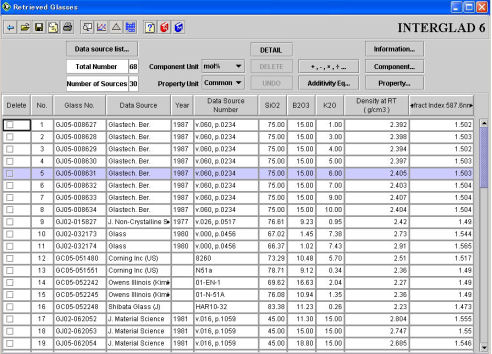
(1) List
Each data element is shown in a line according to its given glass number. Only those data concerning the specified items, glass number, data source, year and data source number are tabulated, but another item can be added on it.
| * | Column shuffling: Any column can be moved to the right or left by 'drag & drop'; simply select the column label and drag it to the desired position. |
| * | Sorting: The data in any column can be sorted according to ascending or descending order. 'Shift-click' the column label to change the sort-direction; all other columns are adjusted accordingly. |
| * | Transition to detailed window: It is possible to change to a detailed window by double-clicking the line. |
1) Deletion checkbox column
Data for which the [Delete] checkbox has been checked cannot be used for analysis (arithmetic operations, additivity equation, X-Y plotting and ternary plotting). Data affected by the [Delete] checkboxes are deleted from the window by clicking the [Delete] button. When a point on an X-Y or ternary plot is deleted, the [Delete] checkbox for the same data is automatically checked in the retrieved glasses table.
Note that a line cannot be selected by using the [Delete] checkbox; you must click on other parts of the line to select it.
2) No. column
The serial number of the output data line is displayed.
3) Glass No. column
The INTERGLAD identification number for each glass is shown.
The first character shows the state of the glass, with normal glass being G, glass-ceramics X, composites C, modified glass M, thin film T, melt F, and non-glass N. The second character shows the data source, with data book being B, academic journal J, proceedings I, patent P, catalogue C, and user data U.
The 3rd to 4th characters indicate the Glass System. For instance, silica glass is 01.
The six-digit figure following the hyphen is the serial number assigned, in the order in which the collected data was recorded.
4) Data Source column
The name of the data source, year and data source number appears in this column. They may be canceled by clicking the checkboxes for those items in the list box obtained by pressing the [Information…] button at the upper right of the window.
5) State, shape, feature, manufacturing method, usage, glass system
These data may also be shown by clicking checkboxes for those items in the list box obtained by pressing the [Information…] button.
6) Composition
The components specified in the query specification window are listed in the retrieved glasses table. As all components included in the output data are shown in the list box opened by pressing the [Composition…] button beneath the [Information…] button, any component can be shown in the table by clicking the appropriate [show/hide] checkbox. The [Component Unit] shown by default is the unit specified in the query specification window. As neither filler, crystal or sol-gel materials were shown in the retrieved glasses table, to see them it will be necessary to open the [Glasses from a Data Source] window or the detail window.
7) Property
Any property specified in the query specification window appears in the retrieved glasses table.
As all properties included in the output data are shown in a list box opened by pressing the [Property…] button, any property can be shown in the table by clicking the [show/hide] checkbox for that property. The default for Property Unit is the Common unit system. The unit for each property shown in the table is not the selection specified in the query specification window, but rather the default unit. However, the default can be changed in the user environment menu via the [User Environment] icon in the main window.
- As properties rendered in blue characters are conditional, it is recommended that such conditions be verified in the detail window.
- Properties rendered in red characters are data of priority levels 2 and 3 among the three categories electric conductivity, AC resistivity and DC resistivity.
- Data described as [Figure] here consists of a table data. (See Chapter 5 / Sec. 3) Figures can be displayed using the detail window.
[Explanation of functions]
(1) [Component Unit] pull-down menu
Conversion of between the mol% and mass% units is possible using the [Component Unit] pull-down menu. In the case of glasses containing components of which molecular weight is uncertain, such as R2O and kaolin, the conversion is impossible, so the pre-existing numerical data is replaced by a red asterisk '*'. The content denoted by a black asterisk '*' remains in its original state after unit conversion even if the glass has the numerical value of the content in the unit specified. In such case the numerical value can be seen in the detail window.
(2) [Property Unit] pull-down menu
Click to change the property unit and convert the property value.
(3) [Information…] button
Click to show or hide the following data relating to the retrieved glasses: Year and Number of Data Source, Glass State, Glass System, Usage, Shape, Feature & Manufacturing Method, Note, Thermal Treatment
(4) [Component…] button
Click to show or hide any component contained in the retrieved glasses.
(5) [Property…] button
Click to show or hide any property belonging to the retrieved glasses.
(6) [Delete] button
Click to delete the lines for which the deletion checkbox is checked.
(7) [Uudo] button
Click to cancel the immediately preceding [Delete] operation.
(8) [Detail] button
Click to show the detail window for a glass selected by clicking on any part of the line other than the deletion checkbox.
(9) [
 …] button
Click to conduct one of the four basic arithmetic operations on Components, Properties, or Component/Property combinations. A small dialog box appears when this [
…] button is clicked. Set the conditions of the operation in this
box to have the result shown in a new column.<Condition of operation>
| * | Two Component and Property columns can be arbitrarily chosen as operands. It is also possible to select a new column for the arithmetic operation. |
| * | Operator: |
| * | New column name: editable |
 or
or  operation between two Component columns is treated as a Property column
and labeled as such, because the numerical result may exceed 100 (%). The
new column resulting from an arithmetic operation between a Component column
and a Property column, or between two Property columns, is treated as a
Property column and labeled as such. The new column may be shown or hidden
by clicking the [Component…] button or [Property…] button.
operation between two Component columns is treated as a Property column
and labeled as such, because the numerical result may exceed 100 (%). The
new column resulting from an arithmetic operation between a Component column
and a Property column, or between two Property columns, is treated as a
Property column and labeled as such. The new column may be shown or hidden
by clicking the [Component…] button or [Property…] button.<About units following an arithmetic operation>
| * | Arithmetic operation results displayed in the composition column: these are based on the unit values existing before the operation; the unit cannot be changed. |
| * | Arithmetic operation results displayed in the property column: these have no unit. |
(10) [Additivity Eq…] button
Click to show the Additivity Equation dialog box and calculate property values for each glass using a additivity equation. The result of the calculation is shown in a new column. The column label is pink.
<Additivity Equation dialog box>
When an equation is chosen from the list of equations, the condition of the restriction is shown beneath the list. Click the [Calculate] button after inputting the temperature or the viscosity, as necessary.
The property value is calculated for all components of each glass. Therefore, a glass which contains components other than the component which the additivity equation treats is not usually calculated. When calculation is executed without regard for the small amount of the component which the additivity equation does not treat, most values may be alright. Calculation without regard to such components is made possible in Ver. 6 by the method of specifying the numerical value to the right of "Total of trace components<" in a small window. The numerical value (maximum) can be selected in seven steps; 0.1, 0.2, 0.3, 0.5, 0.7, 1.0, and 5%.
An asterisk '*' is shown in the retrieved glasses table for glasses unsuited to the conditions of the chosen additivity equation.
See Sec.1 of Chapter 5 for additivity equation details.
Care must be taken to apply the additivity equation only to applicable glasses because the calculation can still execute for inapplicable glasses and the numerical value will be displayed even though the state of the glass is limited to "Glass".
(11)
 [CSV file] icon
Click on the [CSV File] icon to save the result of the retrieval as a CSV file. A dialog box showing the saving options appears when the [Save] icon is clicked.
<Saving options>
· Selection of columns to be saved: Choose those data items to be saved from the list that appears after clicking on the Component, Property or Information tag.
· File name: Saved files are automatically named 'Glass', but this name can be changed. The file-type extension '.csv' is appended automatically.
(12)
[Save] icon Click on the [Save] icon to save the retrieved glass window. The file is automatically named 'list', but this name can be changed; the file-type extension '.igb' is automatically appended.
(13)
[Open] icon Click on the [Open] icon to open a list of files of type '.igb', then click on the name of the desired file. After the file opens, click on the
(14)
[Print] iconClick on the [Print] icon to print the contents of the window.
(15) [Data Source List…] button
A list of data sources consisting of one source per line is displayed by the clicking operation. Glasses from a single data source can be displayed by double-clicking any line of the list.
[Window Navigation]
(1)
 [Glasses from a data source] icon
Click on the [Glass from a Data Source] icon after selecting any lines in the retrieved glasses table to open the [Glass from a Data Source] window, in which all glasses belonging to the same data source as a selected glass No. for the retrieved glass are listed.
(2)
 [X-Y plot] icon
 Click on the [X-Y Plot] icon to open the X-Y plot window.
(3)
 [Ternary plot screen] icon
Clicking on the [Ternary Plot] icon opens a dialog box. After selecting the three components and a property, the Ternary plot window appears.
(4)
 [Data distribution analysis] icon
Click on the [Data Distribution] icon to move to the data distribution analysis window.
(5) [Detail] button
After selecting any lines, click the [Detail] button to move to the detail window. The method of double-clicking the line moves to a detailed window instead of clicking the [Detail] button.
(6) [Data Source List…] button
Click on the [Data Source List…] button to open the data source list.
All glasses from the same data source as a selected glass retrieved through the query specification window are shown. The colored column shows the glass selected from the previous window.
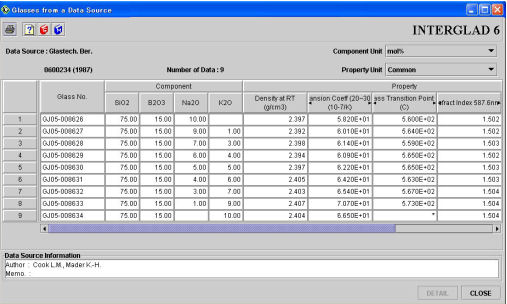
(1) List
The following key data (1 - 6) for each glass is shown in a dedicated column.
1) Glass number
2) Composition
The unit of composition is that specified on the previous window. Using the [Component Unit] pull-down menu, conversion between mol% and mass% units is possible.
3) Filler/Crystal/Substrate
Vol% is used in rare cases though the unit for fillers is usually mass%. It is possible to confirm the use of vol% in the [Note] field of the detail window.
4) Sol-gel raw material
5) Property
Property values indicated in blue are conditional data. It is possible to confirm the condition in the [condition] column of [Properties] field in the detail window.
Property unit can be changed using the [Property Unit] pull-down menu. The default unit is that specified on the previous window.
6) Figure
When table data (See Chapter 5 / Sec.3) or the property equation can be shown by a figure, the note 'Figure' appears in the list. The figure can be opened through the detail window via the [Detail] button.
(2) Information concerning individual data source
Names of all authors, as well as memos concerning glass preparation methods, heat treatment, methods of property measurement, etc., are shown in the Data Source Information box. These data are available only through this window.
[Explanation of functions]
(1) [Component Unit] pull-down menu
Click to change the unit of composition between mol% and mass%. In the case of glasses containing components of which molecular weight is uncertain, such as R2O and kaolin, the conversion is impossible, so the pre-existing numerical data is replaced by a pink asterisk '*'. Asterisks existing before unit conversion continue to appear after unit conversion, but numerical values for the content may be recorded in the detail window in some cases.
(2) [Property Unit] pull-down menu
Use this menu to change the property unit and convert property values in the list.
(3) [Detail] button
Click the [Detail] button after selecting any glass to have the detail window appear.
(4)
[Print] iconDetailed information for each glass is printed. The data that one wants to print is selected in a dialog box.
The details of each glass are shown.
Select a glass in the retrieved glasses window, the [Glasses from a Data Source] window, the [X-Y plot] or [Ternary Plot] windows, the [Query Specification for Regression Analysis] window or the [Glasses for Regression Analysis] window, and click the [Detail] button. The detail window for that glass appears.
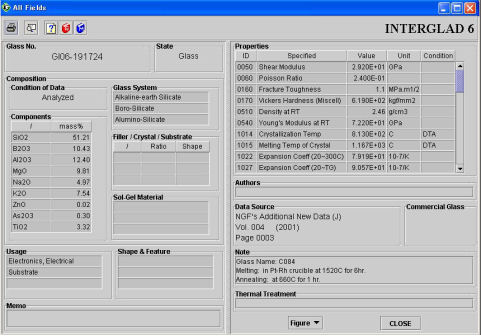
The detail window shows all information for a retrieved glass other than the information concerning individual data source (authors and memos). The units of composition and property are those given at the time of data input.
The unit for the filler column is mass%, although vol% is used in rare cases. (The validity of the vol%
unit may be confirmed in the [Note] field of the detail window in such cases.)
[Condition of Data] field shows that the glass composition given is either that of the analyzed value, the target value or the batch composition.
Authors and memos are not shown in this window. They may be confirmed through the [Glasses from a Data Source] window.
[Explanation of functions]
(1) Displaying figure data
When a glass has figure data, select any figure in the [Figure] pull-down menu to show it.
Figure data is of two kinds:
1) Showing a figure resulting from a property equation (See Sec. 2 of Chapter 5)
When the constants of any of the following property equations for a glass are stored in the INTERGLAD database, the equation can be selected to show the resultant figure.
- Fulcher’s equation (VFT equation)
- Temperature dependence of diffusion (Arrhenius equation)
- Refractive index dispersion equation.
- Temperature dependence of electric conductivity (Arrhenius equation)
- Temperature dependence of DC resistivity (Arrhenius equation)
- Temperature dependence of AC resistivity (Arrhenius equation)
- Thermal expansion curve
- Optical transmission spectrum
- Optical absorption spectrum
- Optical reflection spectrum
- Optical radiation spectrum
(2) Saving figures as CSV files
Table data stored as a figure is saved in CSV file form as is.
(3)
[Print] iconThe display window is printed as is.
(4)
Click on the [Glass from a Data Source] icon after selecting any lines in the retrieved glasses table to open the [Glass from a Data Source] window, in which all glasses belonging to the same data source as a selected glass No. for the retrieved glass are listed.
X-Y plots can be drawn using the retrieved glasses table. The X and Y axes are specified in this window.
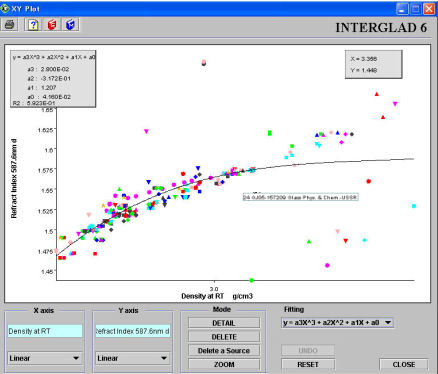
(1) Displaying the graph
The data are plotted after specifying the X and Y axes. The plot data are represented by marks differentiated by both shape and color, according to their data source. A yellow star
1) Specification of X and Y axes
Specify required items in the dialog box shown by double clicking.
2) Scale conversion
Change the scale of the X-axis and Y-axis independently using the pull-down menu.
Linear, inverse, logarithmic and reverse scales are available, with linear preset as the default. When logarithmic or reverse scale is chosen, negative values and zero are not shown.
[Explanation of functions]
(1) [Detail] button (modal)
With the modal [Detail] button active, click on any plot-point. The detail window for the plotted glass appears. The detail window for any plot-point can also be shown using a dialog box called up by right-clicking the mouse.
(2) [Delete] button (modal)
With the modal [Delete] button active, clicking on any plot-point deletes it. The result of the deletion is simultaneously recorded in the checkbox for the glass in question in the retrieved glasses table, and it is shown in the checkbox after closing the X-Y plot window. The deletion of any plot-point can also be achieved using a dialog box called up by right-clicking the mouse.
(3) [Delete a Source] button (modal)
With the modal [Delete a Source] button active, click on any plot-point. All data belonging to the same data source as the plot-point glass are deleted. The result of the deletion is simultaneously recorded in the checkbox of the glass in question in the retrieved glasses window. The deletion can also be achieved using a dialog box called up by right-clicking the mouse.
(4) [Undo] button
Click to undo the last [Delete] operation.
(5) [Zoom] button (modal)
Keeping the modal [Zoom] button active, outline a part of the window by dragging the mouse. That part of the window is enlarged.
(6) [Reset] button
Undoes the previous zoom operation.
(7) [Fitting] pull-down menu
Allows specification of the type of plot-fitting curve: linear, quadratic or cubic.
The constants and the contribution rate of the fitting curve equation are shown in a box at the top-left of the screen.
(8)
[Print] iconThe graph is printed.
The property data of the glasses retrieved are shown on a ternary plot of three components.
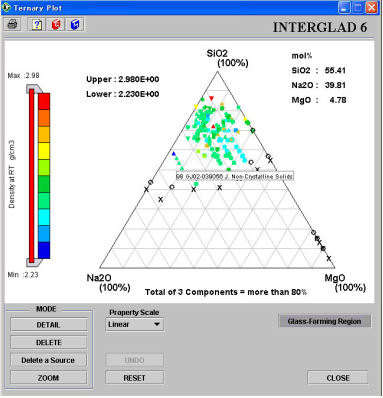
(1) Displayed items
When three components and a property are specified, the following information is displayed:
1) Property name and unit
2) The three components and their unit
3) [Property value] slider
The default maximum and minimum of the slider correspond to the maximum and minimum values of the aggregate plot data. However, pointers on the slider can be used to bypass the default and set upper and lower limiting values. The pointers can be adjusted separately or together (using the bar connecting them).
4) Plot
The property values lying between the upper and lower limits of the slider are plotted. The minimum value of the sum of three components can be specified within the range 0-100% in a small window displayed by clicking the ternary plot icon. Glasses for which the sum of the three components does not reach the minimum value are excluded, and the three components of the remaining glasses are proportionally converted to total 100%.
The color of the plot corresponds to the color of the slider, while they are represented by marks differentiated by shape according to their data source. A yellow star ☆ denotes Gold-Data.
By pointing the cursor at a plot-point, its glass number and data source are shown in a balloon.
5) Glass-forming region
Clicking on the [Glass-forming Region] button shows the glass-forming region of the two or three component system plotted on a ternary diagram.
Completely transparent glass is denoted by a circle "o", while the composition which results in a glass just short of transparency is denoted by an "x". The region to the circle "o" side of the mid-line, lying between the "o" and the "x", is the glass-forming region.
Glass-forming region data are shown only at the boundaries, and not for individual data.
[Explanation of functions]
(1) [Detail] button (modal)
With the modal [Detail] button active, click on any plot-point. The detail window for the plotted glass appears. The detail window for any plot-point can also be shown through a dialog box called up by right-clicking the mouse.
(2) [Delete] button (modal)
With the modal [Delete] button active, click on any plot-point to delete it. The result of the deletion is simultaneously recorded in the checkbox for the glass in question in the retrieved glasses table. The deletion of any plot-point can also be achieved using a dialog box called up by right-clicking the mouse.
(3) [Delete a Source] button
With the modal [Delete Source] button active, clicking on any plot-point deletes all data belonging to the same data source. The result of the deletion is simultaneously recorded in the checkbox of the glass in question in the retrieved glasses window. The deletion can also be achieved using a dialog box called up by right-clicking the mouse.
(4) [Undo] button
Click to undo the last Delete operation.
(5) [Zoom] button (modal)
With the modal [Zoom] button active, specify a part of the window by dragging with the mouse to enlarge that part of the window.
(6) [Reset] button
Undoes the previous zoom operation.
(7) [Property Scale] pull-down menu
Change the scale of the X and Y axes using the pull-down menu. Linear, inverse, logarithmic and reverse scales are available. Linear is set as the default. When logarithmic is chosen, negative values and zero are not shown.
(8) [Glass-Forming Region] button
Clicking the [Glass-forming region] button displays the glass-forming region of the two- or three-component system plotted on a ternary diagram. Glass-forming region data are shown only at the boundaries, and not for individual data.
(9)
[Print] iconThe graph is printed.
Information about composition in the retrieved glasses is shown in the form of a frequency count for each element in the periodic table.
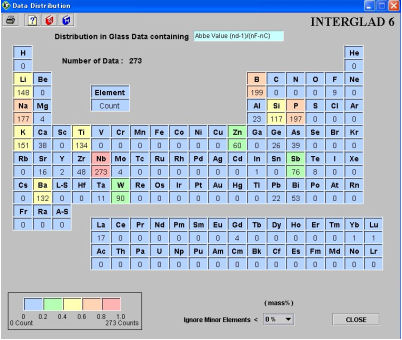
(1) Property name
Using the dialog box which appears by double-clicking in the light blue cell titled [Distribution in Glass Data Containing], select a property.
(2) Periodic table
The frequency of use of each element in retrieved glasses with a specified property is shown under each element’s sign in the periodic table.
The frequency of use of each element included in each glass is counted. For example, if Al2O3 is included in a certain glass, Al is counted once. O (oxygen) is not counted. An element for which the compositional contribution is less than a value specified in the [Ignore Minor Elements] pull-down menu is not counted.
The unit of content is the same as used in the retrieved glasses window. However, the content amount is not the content of the specific element itself, but of the compound in which the element is present, except when at% is the specified unit.
The frequency count for each element is shown in a color according with its level. Five different colors are used, assigned according to the ratio of a given frequency count to the maximum number of counts.
[Explanation of functions]
(1) Minor elements
Choose an upper limit for minor elements from among eight levels: 0, 1, 5, 10, 15, 20, 25 and 30% in the [Ignore Minor Elements] pull-down menu.
(2)
[Print] icon Click to print the window as is.
| BACK | NEXT |